Digma.ai
Uncover code regressions and anomalies from your IDE.
Visit Digma.ai
Visit SiteAbout Digma.ai
Available Platforms
Added on 9/27/2023
Product Information
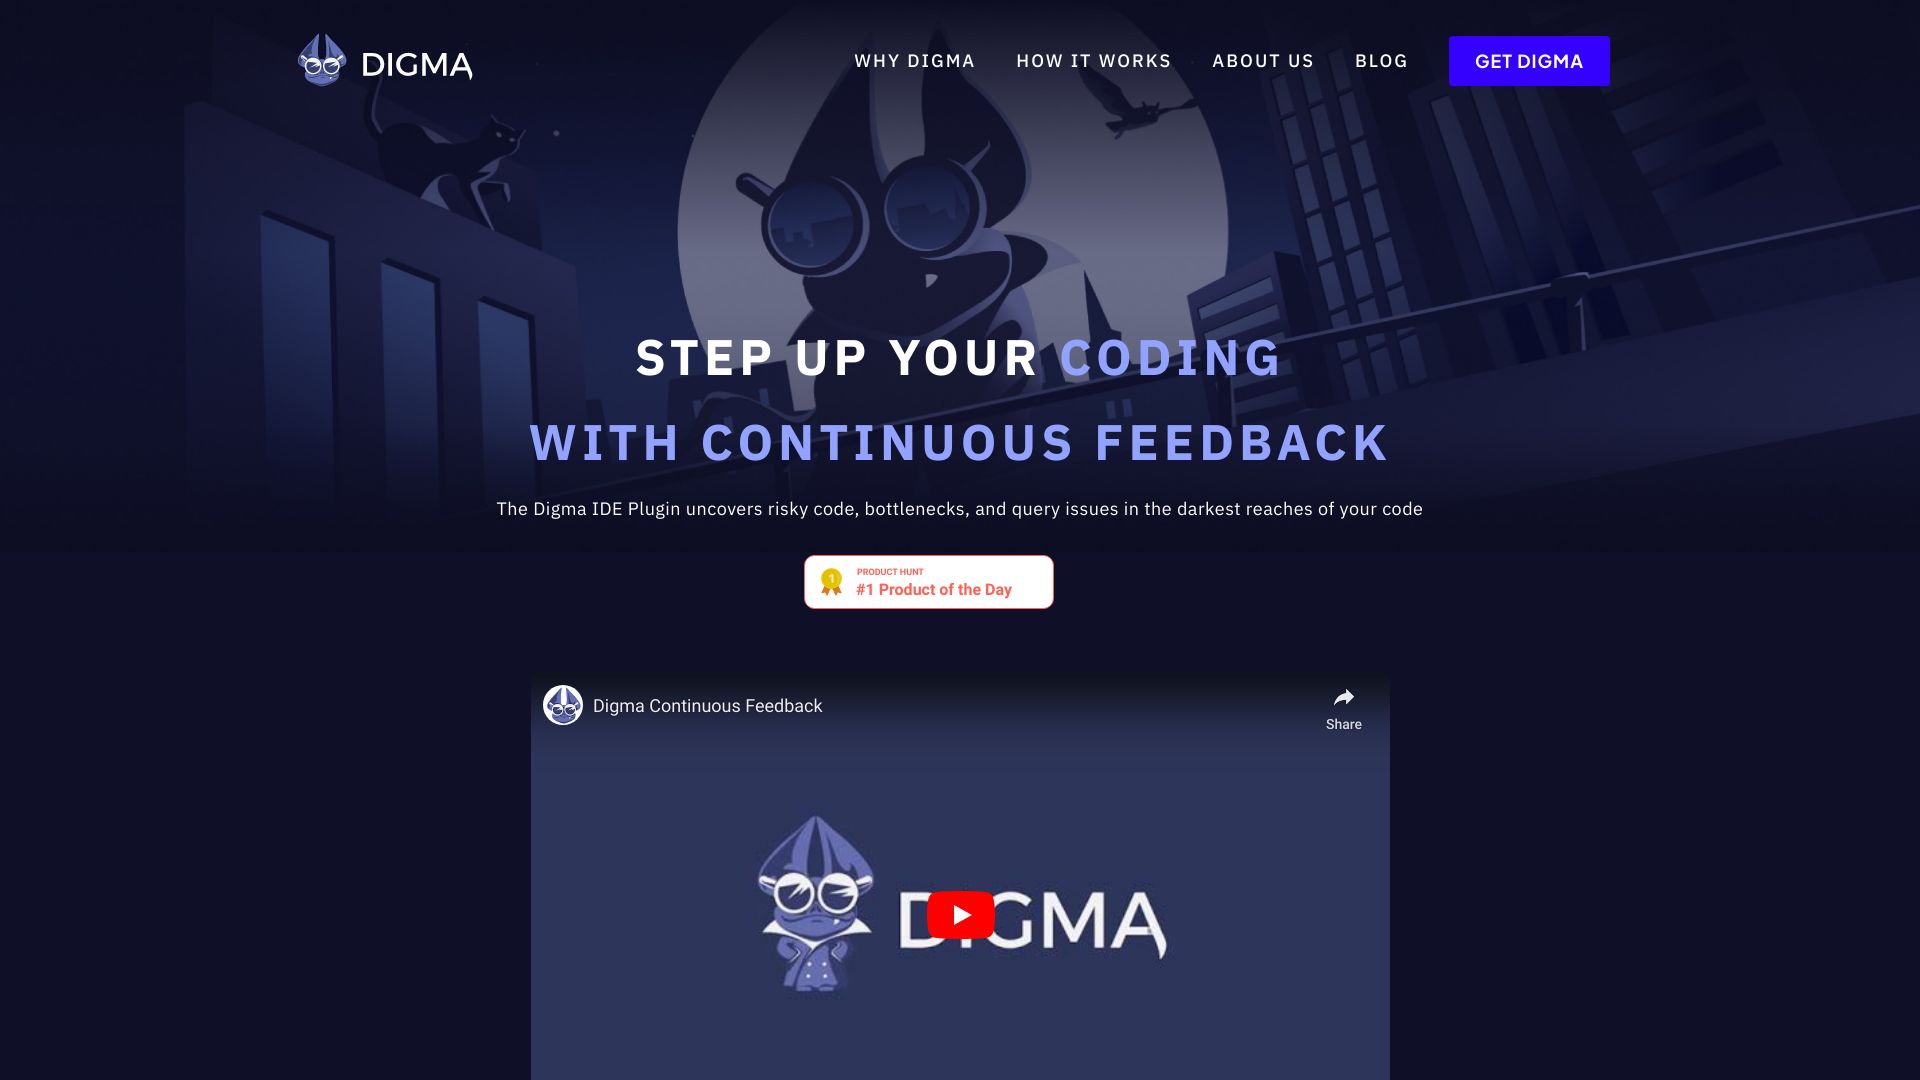
What is Digma.ai?
Digma Continuous Feedback enables developers to uncover code runtime regressions, anomalies and code smells, right from their IDE.
How to Use Digma.ai
Digma.ai's Key Features
Runtime linter for risky code identification
Real-time code issue highlighting
Function scalability analysis
Performance baseline analytics
Recommended For
Identifying code runtime regressions
Uncovering code anomalies and errors
Optimizing code execution times and scaling limitations
Digma.ai Tutorials
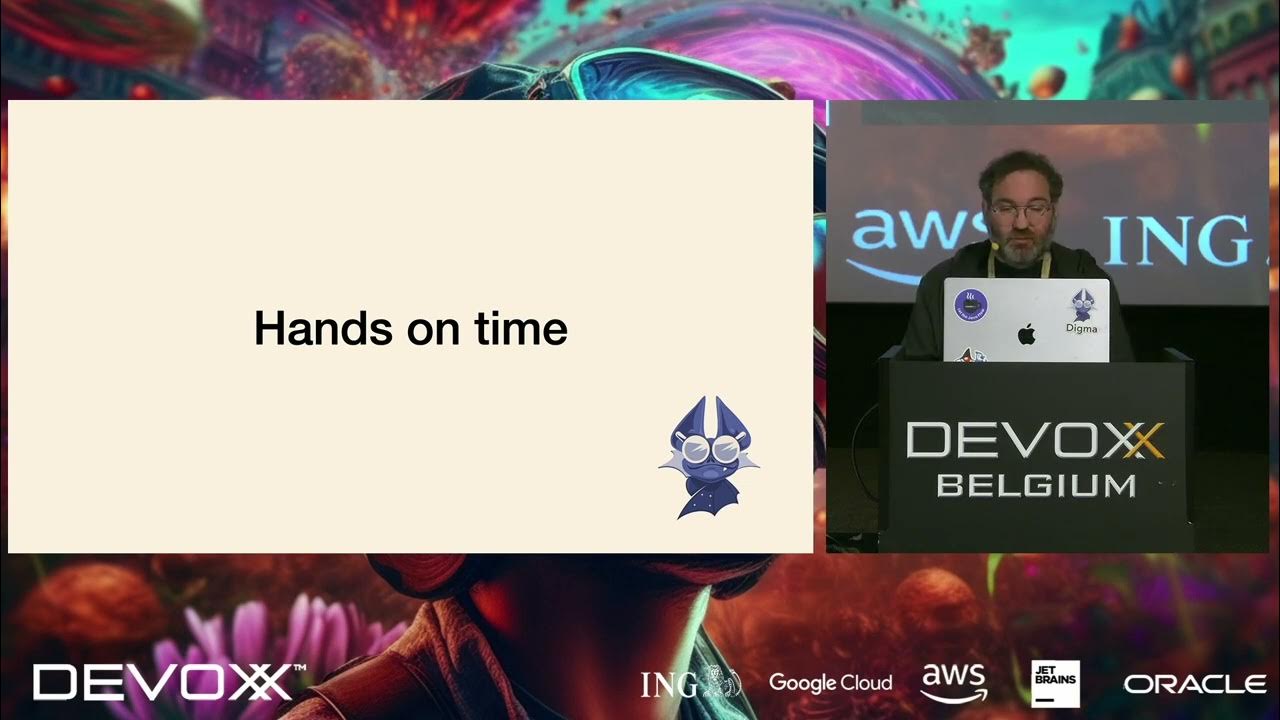
Continuous Code Feedback with OpenTelemetry and Digma By Roni Dover
Digma is a new free IDE Plugin for Continuous Feedback. It leverages OpenTelemetry behind the scenes to analyze your code runtime data as you run debug and test. By detecting code smells, issues, and regressions as-you-code, Digma shortens the feedback loop for developers and accelerates coding in complex codebases. The plugin dynamically lints the code and provides code-lens and analytics integrated into the IDE. In addition, Digma can aggregate existing OTEL data from multiple environments, providing constant visibility and analytics into how the code is performing in the real world: Is it being used? Which functions or components don't scale? Where are the error hotspots? etc. We built Digma as a team of developers frustrated by the growing gap between observability and developers. Whereas observability has advanced considerably in recent years, developers are not yet applying it to its full potential as they write code. Our goal is to make observability transparent. Enable any developer to understand how their code behaves in runtime without having to know anything about OTEL, collector quantiles regressions, or anomaly detection. Instead of presenting shiny dashboards, we decided to create Digma as a platform well integrated into the dev tooling and IDE. In this session, we'll demonstrate what we've done and where we're taking the platform and use some practical code examples to demonstrate how Digma can contribute to the development cycle. RONI DOVER Holistic developer and builder with a passion for development processes and practices. Afflicted by an acute Product Manager/Developer split personality disorder that was never treated. Currently, CTO and co-founder of Digma (digma.ai), an IDE plugin for code runtime AI analysis to help accelerate development in complex codebases. A big believer in evidence-based development, and a proponent of Continuous Feedback in all aspects of Software Engineering.
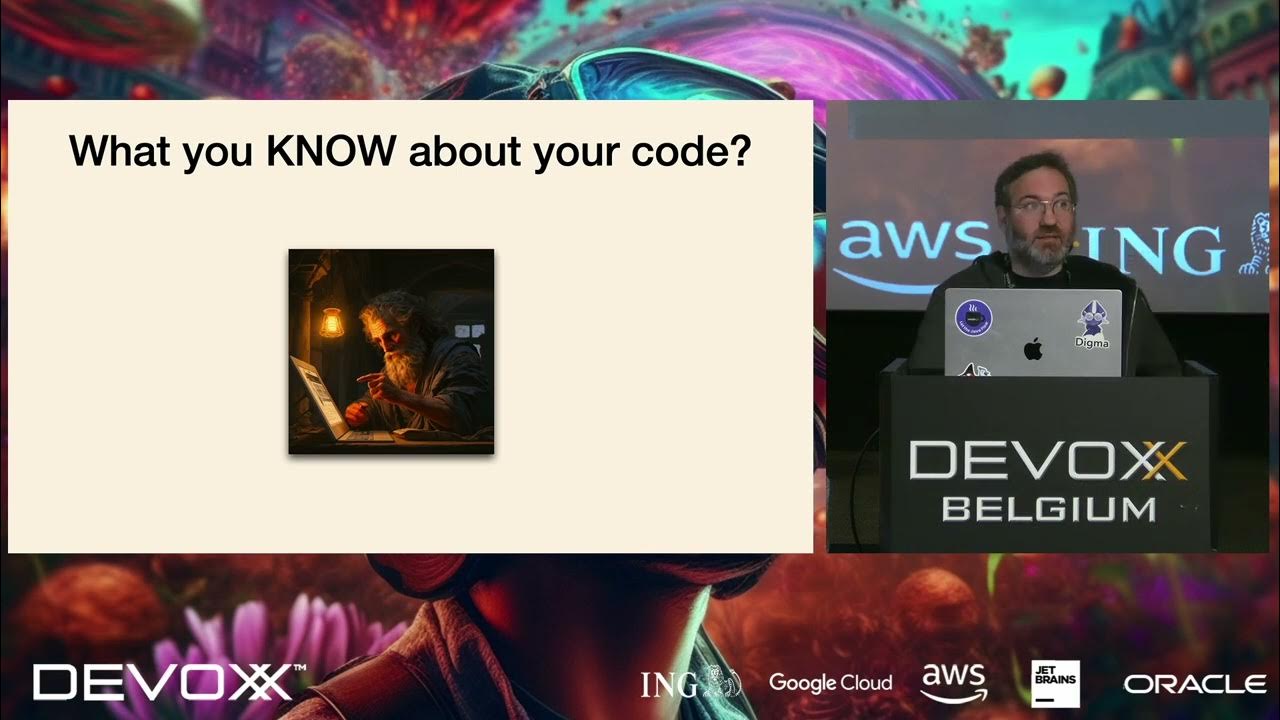
OpenTelemetry and Continuous Feedback by Roni Dover
What do you know about the code changes that were just introduced into the codebase? When will you start noticing if something goes wrong? If there are so many accessible observability sources that can tell us what the code is doing, why are we using so little of that in our day-to-day coding? Continuous Feedback is a new dev practice that aims to make practical usage of code runtime data to shorten the feedback loop during development. It enables developers to get early data about their code changes and detect issues and regressions as-they-code. At the same time, collecting data from multiple environments, allows developers to instantly understand how their code is performing in the real world. In this session, we'll look past the novelty of using OSS observability tools and technologies, to discuss how we can actually make them useful for developers. We'll take a look at the benefits of enabling OpenTelemetry collection for dev and test data and examine OSS tools to help analyze the application runtime. We'll go over code examples of common anti-patterns, code smells, hidden errors, and other types of problems that observability can reveal prior to merging a PR. Ultimately, the goal should not be simply observing the application or creating nice-looking dashboards. Rather, success is in leveraging observability data in order to achieve a more effective dev process and write better code. RONI DOVER Holistic developer and builder with a passion for development processes and practices. Afflicted by an acute Product Manager/Developer split personality disorder that was never treated. Currently, CTO and co-founder of Digma (digma.ai), an IDE plugin for code runtime AI analysis to help accelerate development in complex codebases. A big believer in evidence-based development, and a proponent of Continuous Feedback in all aspects of Software Engineering.
Master Java Profiling: Tools, Techniques, and Real-World Tips
Java profiling allows to rapidly identify and fix performance bottlenecks in your program. In this video we explain what is profiling, introduce popular profiling tools, list their pros and cons, and provide useful tips and code examples. As usual, you can get copy-and-paste examples of the code shown in this video. Follow the link: https://bell-sw.com/blog/a-guide-to-java-profiling-tools-techniques-best-practices/ Introduction 00:00 - Introduction 00:43 - What is profiling 01:28 - The two types of Java Profilers, Instrumenting and Sampling Top-7 profilers for Java Application 02:27 - Java Flight Recorder (JFR) and JDK Mission Control 04:04 - VisualVM 04:45 - Async Profiler 05:32 - New Relic 06:22 - Digma.ai 07:26 - JProfiler 08:14 - YourKit Tools, Techniques, and Hands-on Tips for Java Profiling Master Java Profiling 09:05 - Don’t Overoptimize 09:38 - Identify Key Performance Indicators (KPIs) 09:56 - Don’t trust the profiler blindly 10:26 - Profile the application in production-like environment 10:54 - Profiling is only part of observability Read our blog: https://bell-sw.com/blog/ Visit us on LinkedIn: https://www.linkedin.com/company/bell-sw Get in touch with Catherine on X: https://x.com/cat_edelveis
Featured AI Tools
Passionfroot Discovery
Streamline brand deals with an all-in-one collaboration and management platform.
Guidde - Magically create video documentation
Create How-to Videos in Seconds with AI
VibeLoop
Journaling one vibe a day with magical AI companions
Launch Embeds
Use website badges to drive support from your community for your What the AI Launch. They're easy to embed on your homepage or footer.

Cogniflow
Cogniflow | No-code AI platform - Sign up for free
Liner.ai
Liner.ai - Machine Learning without Code
AskCodi
AskCodi - Your AI code assistant
CodeGeeX
Hugging Face – The AI community building the future.
Riku.ai
Riku.AI | Build No-code Prompts & Datasets for AI Models
Airtest
Learn, improve and generate code with AI | Refraction
Legalese Decoder
Instantly Interpret Free: Legalese Decoder - AI Lawyer Translate Legal Docs To Plain English
Akkio
Modern Business Runs on AI | No Code AI - Akkio
Obviously AI
Data Science without Code | Obviously AI
Generative BI
Generative BI: No-code AI reporting platform
Similar AI Tools
Cogniflow
Cogniflow | No-code AI platform - Sign up for free
Liner.ai
Liner.ai - Machine Learning without Code
AskCodi
AskCodi - Your AI code assistant
CodeGeeX
Hugging Face – The AI community building the future.
Riku.ai
Riku.AI | Build No-code Prompts & Datasets for AI Models
Airtest
Learn, improve and generate code with AI | Refraction